You can easily create custom charts and send them automatically to selected recipients.
1. How to create new charts
If you are missing the dashboard you need, simply go to the report builder and create it in 5 min. You will find there all your custom dashboards.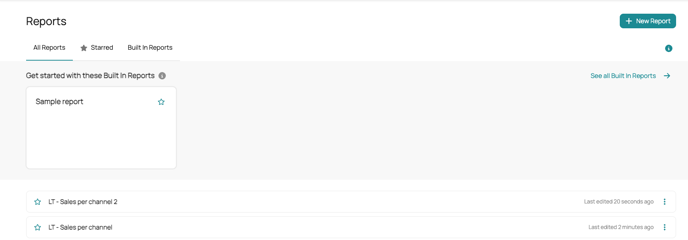
- Go to Analytics > Report Builder
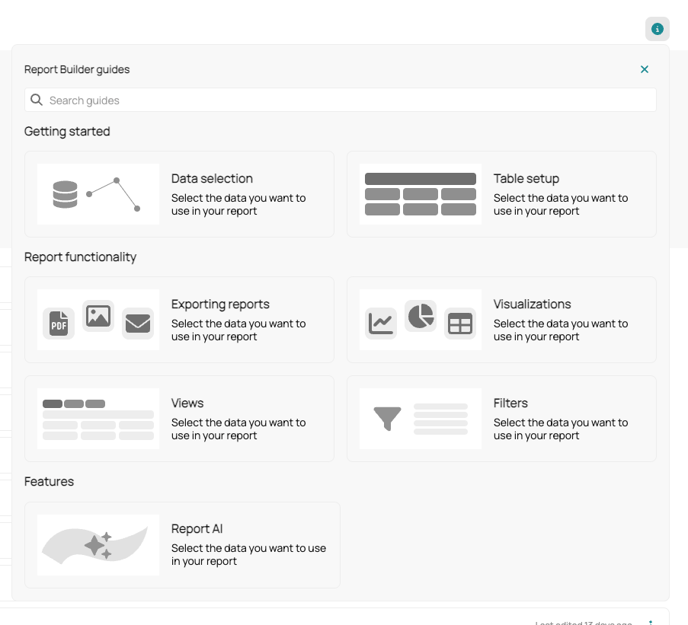
- If you have questions, click on the info box on the right and a guide will appear
- To create a new dashboard, click on "+ New report"

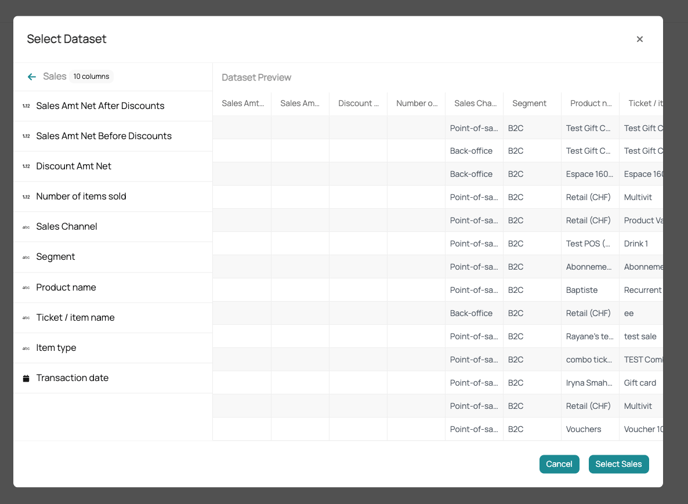
- Select a dataset
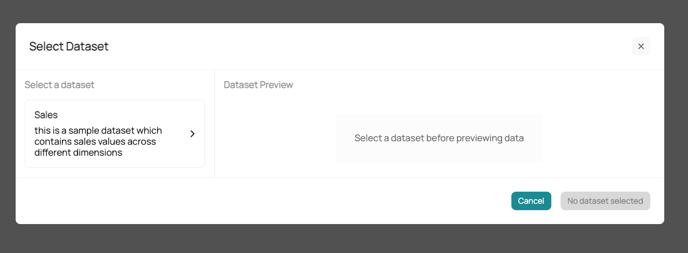
- Click on Select sales
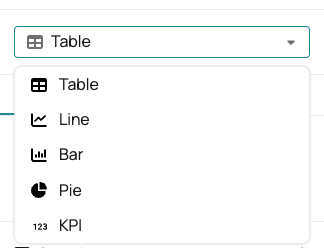
- Build your dashboard by selecting which type of chart you need on the right
- Then fill out the Data section
- Add values (what you want to appear in the chart, for ex. sales amount)
- Group them (how you want to show the data, for ex. grouped by sales channels, by segment, etc.)
- Breakdown (for tables, you can add another layer and break the data down)
- Columns (here you will have all the data that you can use listed)
- Now you can see the charts you have created
- For example a pie chart with the sales volume, grouped by sales channels
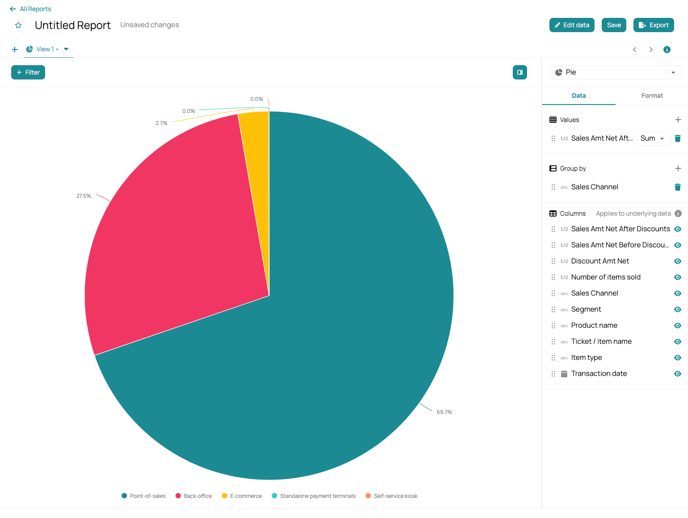
- Or a table with the sales volume before and after discount and the amount of items sold, grouped by sales channels, broken down by segment

- For example a pie chart with the sales volume, grouped by sales channels
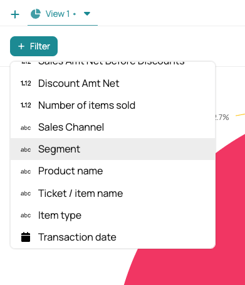
- You can also add filters to only show a part of the data
- For example only show "Segment = B2C"
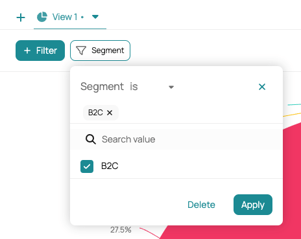
- For example only show "Segment = B2C"
2. Schedule emails to send dashboards
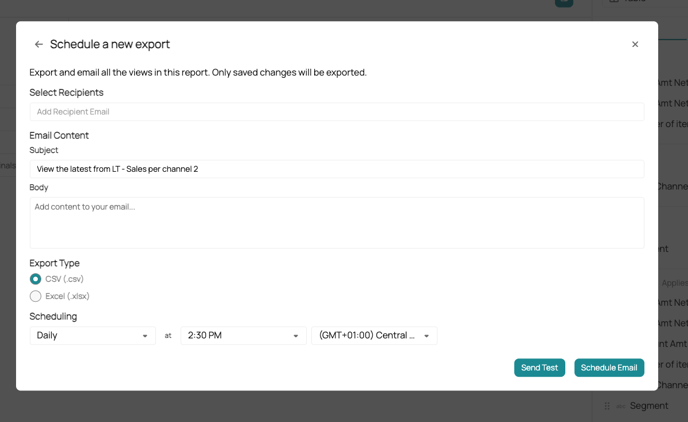
You can now export the charts and schedule emails to be sent automatically.
- Click on Export > Schedule an email

- Setup the scheduler
- Select recipients
- Add a subject and body
- Select the export type
- And the scheduling frequency
