This article explains the tools and graphs on the KPI analytics page.
Table of contents:
1. Controls
You can select the time range in which you wish to view the data. Then you can filter by Location, Product, Ticket, Ticket date & Source.

2. Primary Key Indicators
The first half of the dashboard appears as below: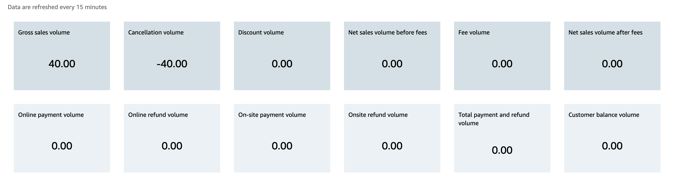
- Gross sales volume: The number of tickets that were sold during the period, multiplied by their prices.
This figure does not account for reductions. E.g. promo codes that have been redeemed, discounts or gift card purchases.
Example: Ticket A costs $60, Ticket B costs $50 and was bought using a 50% promo code. The value indicated will be $110
- Cancellation volume: The number of tickets that were cancelled during the period, multiplied by their original price, regardless of when they had been purchased (or if a discount/promo code was used).
Example: Ticket A costs $60, Ticket B costs $50 and was bought using a 50% promo code.
These tickets are both cancelled during the range selected.
The total value of cancellation indicated will be $110.
- Discount Volume: The amount deducted from the purchases (e.g. from redeemed promo codes, discounts or gift card purchases).
*Note that it also includes bookings that are imported.
Example: Ticket A costs $60, Ticket B costs $50 and was bought using a 50% promo code. The total value indicated will be $25.
(This is because only Ticket B was bought with a discount)
- Net sales volume before fees: Total value of sales (taking discounts into consideration). This number won't deduct the balance that is still due to be paid by customers who have booked their tickets.
Example: Ticket A costs $60 and only $45 has been paid at the point of booking, Ticket B costs $50 and was bought using a 50% promo code. The total value that will appear, for both tickets, will be $85.
($60 for Ticket A - even though the customer has only paid $45, so far and $25 for Ticket B after a 50% discount is taken into consideration).
- Fee volume: This is the sum of payment fees and booking fees which are applied to the ticket sales during the selected period.
- Net sales volume after fees: This is the same figure as 'Net sales vol. before fees', but with all fees to be paid to Smeetz, also deducted.
- Online payment volume: Value of payments from online sales during the defined time range.
Example: Ticket A costs $60 and only $45 has been paid through create a sale. Ticket B costs $50 and was bought using a 50% promo code online. The value indicated will be $25.
(This is because Ticket A was not purchased online but through the 'create a sale' back office. Therefore, it will not be reflected in the 'online payment volume').
- Online refund volume: The amount refunded online.
Example: Ticket A costs $60 and only $45 has been paid through create a sale. Ticket B costs $50 and was bought using a 50% promo code online. Both tickets were refunded during the time range. The value indicated will be $25.
(This is because Ticket A was not purchased online, but through the 'create a sale' back office and so cannot be refunded online).
- Onsite payment volume: Value of payments from onsite sales during the defined time range.
- Onsite refund volume: The amount refunded onsite.
- Total payment & refund volume: This is the sum of the total onsite and online payment volume and the onsite and online refund volume.
- Customer balance volume: The amount that customers are expected to pay in order to complete their purchase.
Example 1: Ticket A costs $60 and only $45 has been paid during the booking, Ticket B costs $50 and was bought using a 50% promo code. The value indicated will be $15.
(This is because Ticket A has an outstanding balance of $15. Total value $60 minus $45 already paid = $15 while Ticket B has been paid in full, following redemption of promo code. So there is no balance remaining)
Example 2: Ticket A costs $60 and has been cancelled but not refunded yet. The value indicated will be -$60.
(This is because, in this case, it is the organiser who owes money to the customer).
3. Secondary Indicators
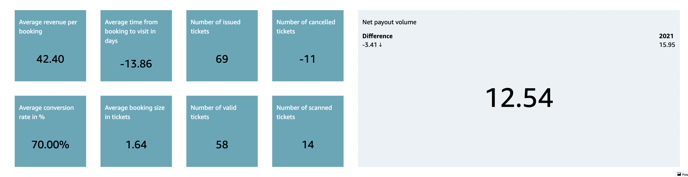
- Average revenue per booking: The average size of the basket per booking.
- Average time from booking to visit in days: Time between when the booking was made and when the customer attended the event/visited the venue (recorded in days).
- Number of issued tickets: The number of issued tickets sold during the selected date range.
- Number of cancelled tickets: The number of tickets cancelled during the selected date range.
- Average conversion rate in %: Indicates the average booking conversion rate, as a percentage, of the traffic visiting your website during the selected date range.
- Average booking size in tickets: Indicates the average number of tickets within a booking (basket).
- Number of valid tickets: The number of issued tickets - minus the cancelled ones during the selected date range.
- Number of scanned tickets: The number of scanned tickets during the selected date range.
- Net credit volume: Indicates the total amount in payment that you will receive during the selected date range.